The Cost Of Power BI is Amortized In a Short Time By Your Company
Do you want to know if your company can amortize the cost of a Power BI consultancy in a short time?
Find out through the video we made for you, which you can see above.
Business intelligence is the critical business component to ensure agile, competitive, and effective management of your organization.
As businesses grow, managing the amount of data they generate becomes challenging.
This is why so many companies have embraced business intelligence systems to a large extent.
Creating an analytical system to analyze data effectively helps a company decode a lot of information, which helps suggest conclusions and support advanced decision-making.
Microsoft Excel has always been the reporting tool used by companies – most likely you use it too – but the Bill Gates giant, with its proven track record in the field of technological innovation, has come to the fore with the introduction of its tool analytics: Power BI.
This reporting tool allows businesses to quickly visualize and analyze business data to transform it into effective operations.
Its speed in displaying and calculating large amounts of data and its ability to provide answers in real-time makes it a tool capable of offering much more detailed information than Excel.
The cost of a Power BI consultancy can be amortized in a concise time for these and other advantages.
Let’s see why.
How Power BI pays for itself over the long term
Microsoft Power BI is a suite of business analytics tools designed to help businesses examine data and share insights.
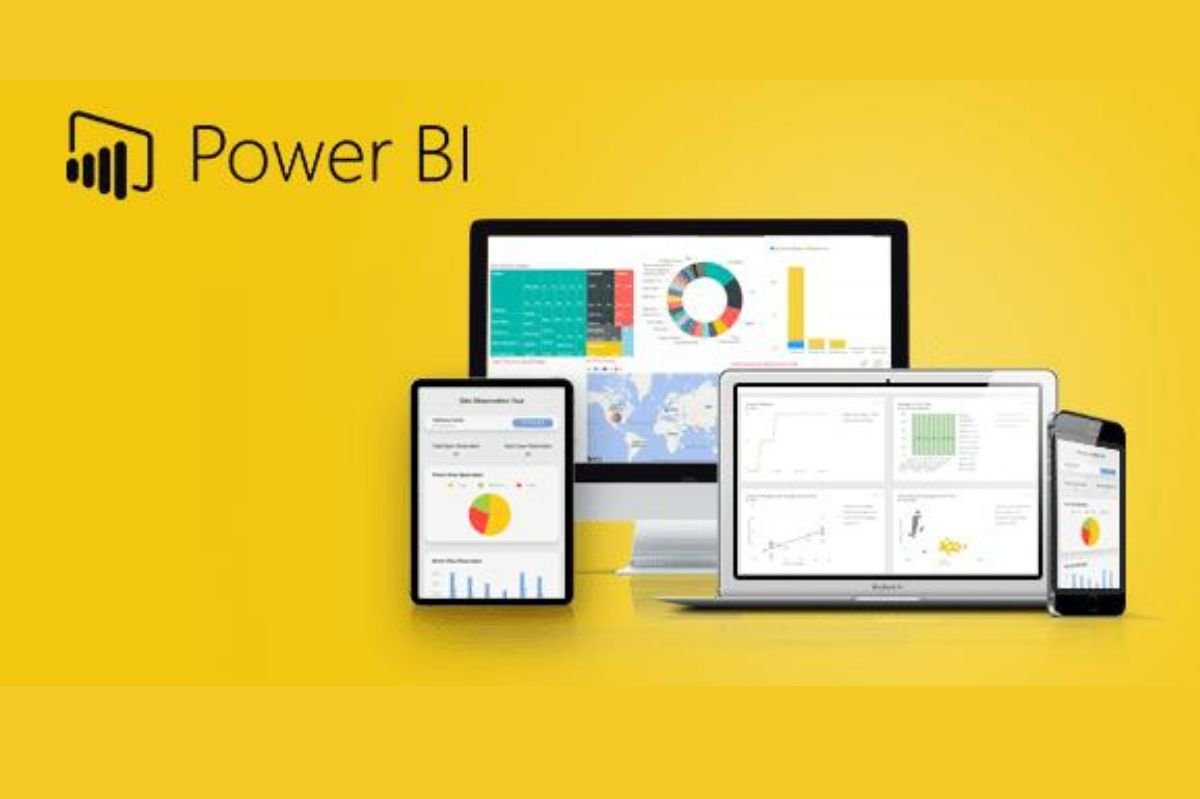
Microsoft Power BI converts company data into very captivating and understandable graphics, facilitating the collection of information and consequently facilitating the definition of effective business strategies.
The system was created to offer a continuous data update service, identify current trends and guide your business toward success.
The platform also helps you track your activities and get quick answers through comprehensive dashboards that are always available on all devices.
The company also recently launched Power BI Embedded, a powerful new version with additional reporting capabilities that can be easily embedded within apps, websites, or portals to deliver world-leading analytics solutions.
However, what users appreciate most about this system is the ability to share reports and view them directly on the web so that anyone can access them anywhere.
Ok, at this point, the question arises: what are the real advantages this tool can provide me compared to the current Excel sheet?
We’ll tell you right away.
Store a vast amount of data
Power BI offers an awe-inspiring compression capacity compared to Microsoft Excel, and its text files allow you to view and analyze vast amounts of data that Excel can’t open.
Can you imagine storing, connecting, and profoundly analyzing your files using only 50MB?
Maybe not yet, but now it’s a reality.
Thanks to Power BI, you can have all the data you need in one place. It allows you to integrate a large amount of data from different sources into a single report, compare them and get the answers you need.
All the details and more substantial summaries can coexist in a single file and be accessible via drill down.
In addition, Power BI also offers the possibility to edit and set up your data:
- You can add relationships within different tables, which helps make large datasets interact with each other.
- You can easily add new datasets from various sources, such as Excel, CSV/text, MySql databases, and many more. You can integrate new useful data in one click to make your reports more effective.
With Power BI, time-consuming data preparation steps are reduced or eliminated entirely, as the software will remember the data preparation steps and automatically repeat them during refresh.
Spot trends in real-time and help you make better decisions
Analyzing trends is extremely easy with Power BI.
With built-in time intelligence capabilities, it takes seconds to visualize huge amounts of data updated in real time. You can access data based on various dimensions and attributes, including date and time.
As a consulting firm, we often come across corporate executives who spend countless hours each month compiling Excel macro files to compare their data over time.
If you also belong to this category, know that by requesting a simple Power BI consultation, you can save a lot of time.
Custom display options
With Power BI, creating something visually appealing and uncluttered is extremely easy.
Drag and drop, copy and paste capabilities, and ease of resizing make those familiar with Microsoft’s suite feel at home using this tool.
The ability to configure text style and colors makes creating a branded Power BI theme easy.
What does it mean?
In the Power BI report view, you can choose the visual that fits your needs the most. With these elements, you will be able to represent your data better and display them in graphs or matrices.
You will be able to say no to boring scrolling tables and create personalized graphics that will allow you to understand your company’s progress in a few moments.
Use the cloud
Once you’ve finished building your analysis with Power BI, you can provide your employees access to dashboards and reports.
With Excel, this involves sending a large file by e-mail or placing it on a shared drive or in the SharePoint portal and notifying you that the information has been updated.
With Power BI, this process has been completely turned upside down.
You can now publish data to Microsoft’s cloud service, called Power BI Service, and add or remove users at any time. You’ll also get enterprise-grade IT tools that scale with user-level and data-level pricing.
Row-level security
Row Level Security (RLS) is challenging to achieve with Excel, while with Power BI, it can be easily accomplished even by non-programmers.
A valuable feature of RLS is to grant employees limited access to data, for example, based on their geo-location.
Setting up these access filters is simple, and the risk of others seeing data they shouldn’t have access to is far less than with an Excel file.
Conclusions
Power BI is an easy-to-use tool that helps steer organizations into an analytics-driven culture. Thanks to its powerful self-service features, your employees will no longer have to depend on the IT department for data collection, processing, and analysis.
Automating mass data integration, ease of creating new data sources, speed of visualization, and row-level security are among the many reasons Power BI has become necessary for businesses.
Well, yes, yours too.
In the age of analytics, organizations need to use the collected data intelligently to rapidly evolve and adapt to changing market and consumer habits.
The future is increasingly analytics oriented: companies are moving to be able to incorporate business intelligence systems so that they can eliminate tabular reports containing huge amounts of numbers. And the efficiency of Power BI lies precisely in this:
- It allows you to aggregate various data sources in one place ;
- It allows you to normalize and analyze them directly without modifying the original sources;
- It allows you to gather valuable data for business decision-makers in a short time, filtering them according to needs.
In short, with a few small tricks, you too can start using Power Bi and turbo-charge your business!
Also Read : Where Do You Need To Start To Do Data Analysis?


